BERKELEY, CA (UroToday.com) - We reviewed our 10-year experience of kidney transplantation in African American compared to Caucasian American recipients at Cleveland Clinic between the years 1995 and 2004. Our objective was to study whether disparities in access and outcomes of renal transplantation in AAs compared to CAs exist and if so to identify predictors of graft and patient outcomes in AA versus CA renal transplant recipients.[17, 18] African Americans (AAs), often suffer disproportionately from health disparities compared to Caucasian Americans (CAs) including in the incidence and outcomes of kidney disease, transplant allocation, and transplant outcomes.[2]
AAs lower socioeconomic conditions have historically resulted in less access to health care which has translated in less access, also, to renal transplantation. Potential AA transplant candidates have been documented to be less often referred for transplant evaluation than CA candidates[4, 5] and have longer mean waiting times for transplantation.[6] The merits of living donor (LD) renal transplantation include dialysis avoidance, shorter waiting times, and superior graft survival compared to deceased donor (DD) renal transplantation.[7] Despite the observed advantages of LD transplantation, AAs are less likely to present with a potential living donor, and thus AAs more commonly receive DD allografts.[8, 9]
Materials and Methods
Included in the retrospective analysis were 772 patients (recipients of first allografts) who received first kidney allograft transplantation between 1995 and 2004. 604 (78%) were CA and 168 (22%) were AA.
Results
Recipient Characteristics
Recipient characteristics (Tables 1A, 1B) for DD and LD transplants demonstrated no significant differences in gender, age, BMI, or transplant PRA between AA and CA recipients. The primary diagnosis of hypertension was more common in AAs: 36% of AAs compared to 6.2% of CAs for DD transplants (p < .0001), and 22% of AAs compared to 4.6% of CAs for LD transplants (p < .0001). Among LD transplants, AAs had a higher rate of glomerular disease than CAs: 40% for AAs vs 26% for CAs (p=.04).
Additional significant differences were apparent for DD transplants: 23% of AA were Medicaid patients compared to 7.0% of CA (p < .0001); DM2 occurred more frequently in AAs (15% vs 4.1%, p=.0009), whereas DM1 occurred more frequently in CAs (37% vs 21%, p < .0001). In addition, 83% of AAs were treated with hemodialysis (rather than peritoneal dialysis) compared to 72% of CAs (p=.02). An important finding was the longer course of pre-transplant dialysis for AAs (911±618 days vs 682±526 days, p=.0006), and greater time on the waiting list for AAs (972±575 days vs 637±466 days, p<.0001).
Donor Characteristics
Donor characteristics for AA and CA renal transplants demonstrated no significant differences in donor gender, age, BMI, creatinine, and cause of death for DD, and a similar mix of related/unrelated donors, female donors, and donor BMI for LDs. Among DD transplants, 93% of CAs had a racially matched donor, compared to 30% of AAs (p < .0001). CA recipients were more likely then AAs to receive an organ from a head trauma victim (39% vs 29%, p=.05). For LD transplants, CAs again were more likely to have a racially-matched donor (100% of CAs compared to 94% of AAs, p < .0001). Mean donor age was 38±8.8 for AAs compared to 43±9.1 for CAs, p=.0003. Live donor creatinine was 0.84±0.20 for CA recipients compared to 0.97±0.25 for AA recipients, p=.0001.
Transplant Characteristics
In DD renal transplants, AAs had more HLA mismatches than CAs (4.1±1.4 vs 2.7±2.1, p < 0.0001). In LD renal transplants, HLA mismatches were comparable for AA and CA recipients (2.9 ± 1.5 and 2.8 ± 1.8 respectively).
Immunosuppression
AAs and CAs received similar induction immunotherapy regimens, with basiliximab given most frequently. For maintenance immunosuppression, among LD renal transplants, a larger percentage of CAs received sirolimus than AAs (43% vs 26%, p=.02), and a correspondingly smaller percentage of CAs received calcineurin inhibitors than AAs (56% vs 70%, p=.06). Also in DD transplants, a larger percentage of CAs received calcineurin inhibitors and azathioprine than AAs (47% vs 35%, p=.02 and 16% vs 8.5%, p=.04, respectively).
Graft Function
Among DD transplants, delayed graft function occurred in 48% of AAs compared to 26% in CAs (p < .0001), and at all but 6-months post transplant, creatinine values were significantly higher among AAs than CAs. Among LD transplants, higher creatinine values for AAs, reached marginal significance only at 36 months (2.8±2.9 vs 1.7± 1.4, p=.05).
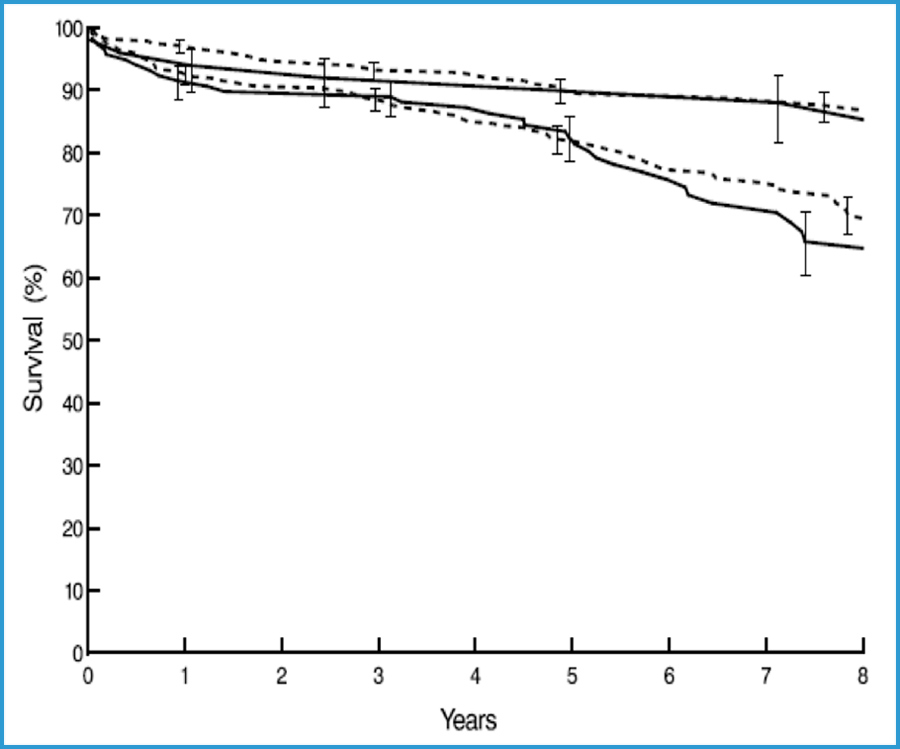
Patient and Graft Survival
Mean follow-up for survivors in the study was 7.1±2.5 years. Among LD transplants, graft survival was comparable for AAs and CAs; however among DD transplants, graft survival was substantially worse for AAs (p=.0003) (Table 2, Figure 1). In both LD and DD transplants, patient survival was similar for AAs and CAs (Table 3, Figure 2). Statistically significant predictors of late graft failure include AA recipient (p=.01), older donor age (p=.0005), donor age < 10 years (p=.03), and greater donor BMI (p=.001). Greater hazard of death in the early period after transplant was associated with older recipient age (p=.0001), Medicaid insurance coverage (p=.02), and donor cause of death not being head trauma (p=.02). Recipient race was not a significant predictor of death in either the early or late hazard phase, either by itself, or after adjusting for other significant factors in the model.
Discussion
There are well documented disparities between AAs and CAs in the incidence and outcomes of a number of diseases including access to and outcomes of kidney transplantation.[10, 11, 12, 13, 14, 15] It is clear that AAs are disadvantaged in gaining access to renal transplantation (both DD and LD) in a time frame comparable to CAs despite having higher rates of ESRD than the general population. When analyzed, the barriers seem to occur at almost every stage on the path to kidney transplantation.[16, 17, 18] While there are disparities in access to LD in AAs compared to CAs, we demonstrate no disparate outcomes in patient or graft survival or graft function following LD transplantation.
A number of factors known to affect outcomes occur in different rates in our AA and CA DD recipients. AAs have lower socioeconomic status and greater incidence of poverty (24.5% AA vs 8.2% CA) contributing to decreased rates of private insurance,[19] increased pre-transplant co-morbidities resulting from a primary diagnosis of ESRD from type 2 diabetes and/or hypertension,[20] longer time course on dialysis pre-transplantation,[21] greater incidence of pre-transplant hemodialysis (HD) vs peritoneal dialysis (PD),[22] greater elapsed time from referral to transplant, and greater time on the waiting list. AA DD transplants also appear disadvantaged by AAs having greater numbers of HLA mismatches[23, 24] as well as a lower percentage with donor cause of death due to head trauma.[23] The disparities seen in longer times on dialysis pre-transplant in AAs, as well as the type of dialysis selected in AAs, may represent a combination of recipient factors as well as health provider/health system biases.
Even after adjusting for recipient and donor age, donor BMI and duration of recipient pre-transplant dialysis, AA race still predicted a higher rate of graft failure following kidney transplantation.
During the time period of our analysis, the organ allocation system was heavily weighted on the degree of donor to recipient HLA match, which several studies have demonstrated disadvantaged AAs and relegated them to waiting longer to receive allografts.[26, 27, 28] In our study, there was no significant difference in the degree of HLA mismatch in AA LD recipients compared to CA LD recipients, perhaps contributing to the similar graft function and survival outcomes in AA and CA LD recipients. Another donor factor that approached significance with respect to race involved the donor cause of death, which was more often related to head trauma in CA than in AA recipients. Our survival models predicted worse outcomes for DD transplants in which donors were at the extremes of age, > 50 or < 10 years, and our data indicate AAs received DD kidneys from donors at these age extremes somewhat more often than CAs.
In our study, AA recipients of DD kidneys experienced a higher rate of graft failure than CA recipients. Some preexisting medical conditions and co-morbidities that occur more often in AAs contribute to this worse outcome. These include a greater incidence of pre-transplant diabetes and severe hypertension, which are often the cause of ESRD for AAs. Interestingly, in our series AA vs CA LD recipients did not demonstrate a greater incidence of ESRD from type 2 diabetes, perhaps contributing to the equivalent outcomes in the two groups.
AA recipients of DD allografts in our series had a 34% longer period on dialysis prior to transplantation than their CA counterparts (p=.0006), but AA recipients of LD allografts had only a 21% longer period on dialysis (p=.2).
We did not demonstrate a significant racial difference in time from referral to listing at our center. This may point out that expeditious listing of patients can be attained by close communication between referring nephrologists and the transplant center. In addition, our deliberate efforts to educate and facilitate patients completing their evaluations in a timely fashion may have played an important role.
Previous reports have identified delayed referral to a transplant center for evaluation as a contributing factor for worse outcomes in DD transplantation of AAs.[12, 13, 31] The reasons for delayed referral of AAs for transplantation compared to CAs relate to a relative lack of access to health care services due to socioeconomic factors, including a lack of private health insurance. Among DD recipients in our series, 23% of AA vs 7% of CA patients were on Medicaid, p < .0001. Socioeconomic factors may influence health care provider and health care system decision making in referring patients for transplantation and in choice of selection of post-transplant immunosuppressive maintenance medications as well as patient adherence to post-transplant medication regimens. At our center there was no difference in insurance status in AA vs CA LD recipients, again perhaps contributing to the equivalent outcomes of LD transplantation in the two groups.
Other reasons why AAs may experience longer times on dialysis prior to transplant, distinct from socioeconomic considerations, may relate to disparities in education regarding improved outcomes of transplant over dialysis as well as deficiencies in kidney disease and transplant health literacy. Efforts to increase education and awareness in AA ESRD populations regarding the improved survival outcomes following transplantation, especially living donor transplantation, are important.[29] Such educational programs should be the responsibility of each nephrologist, transplant center, and physician who takes care of patients at risk for kidney disease, as well as those already afflicted with ESRD.
It would appear that many of the impediments to access to transplantation also result in fewer AAs having options for LD transplantation. In our series, 30% of AA patients received a LD renal transplant vs 46% of CA patients. Reports have identified AA race to be associated with lower odds for utilizing LD renal transplantation with partial reasoning identified that is potential AA kidney donors are more likely to be excluded due to incidentally diagnosed medical conditions.[30, 31, 32]
In conclusion, AAs develop ESRD at greater rates than CAs and have a disproportionate need to receive kidney transplants. We performed an analysis of renal transplantation at our center comparing AAs to CAs focused on survival outcomes, any racial disparities, and potential contributing factors. Our data shows that when AAs receive allografts from LDs they have equivalent short- and long-term outcomes to CAs. However, we also demonstrated that following DD transplantation, AAs have worse short- and long-term outcomes resulting from a combination of recipient, donor, and health provider/health system factors. Consequently, we propose that AAs with ESRD be educated regarding the merits of transplantation over dialysis to treat ESRD, and encouraged to aggressively seek referral for kidney transplantation. We also emphasize that AAs should be educated about the benefits of LD transplantation, and encouraged to seek LD options whenever possible.
 |
| Figure 1: Graft Survival by Recipient Race and Donor Type |
 |
| Figure 2: Patient Survival by Recipient Race and Donor Type |
| African American N=118 |
Caucasian N=332 |
P | |||
| Recipient Characteristic | N | Count (%) | N | Count (%) | |
| Gender Female | 118 | 47 (40) | 322 | 112 (35) | .3 |
| Age, years (mean ± SD) | 118 | 47 ± 14 | 322 | 48 ± 12 | .5 |
| Age < 10 Years | 118 | 2(1.7) | 322 | 1(0.31) | |
| Age > 50 Years | 118 | 47(40) | 322 | 145(45) | |
| BMI, kg/m2 (mean ± SD) | 113 | 27.4 ± 5.6 | 308 | 26.4 ± 4.4 | .1 |
| Medicaid patient | 99 | 23 (23) | 299 | 21 (7.0) | <.0001 |
| Primary diagnosis: glomerular disease | 118 | 28 (24) | 322 | 63 (20) | .3 |
| Primary diagnosis: hypertension | 118 | 42 (36) | 322 | 20 (6.2) | <.0001 |
| Primary diagnosis: polycystic disease | 118 | 4 (3.4) | 322 | 42 (13) | .003 |
| Diabetes | 118 | 42 (36) | 322 | 134 (42) | .3 |
| DM 2 | 118 | 18 (15) | 320 | 13 (4.1) | .0009 |
| DM 1 | 117 | 24 (21) | 321 | 120 (37) | <.0001 |
| Pre-transplant dialysis type | 115 | 301 | .02 | ||
| Hemodialysis | 115 | 96 (83) | 301 | 217 (72) | |
| Peritoneal Dialysis | 115 | 19 (17) | 301 | 84 (28) | |
| Pre-transplant dialysis duration, days (mean ± SD) | 115 | 911 ± 618 | 301 | 682 ± 526 | .0006 |
| Pre-transplant PRA | 118 | 4.2±17 | 322 | 4.0±14 | .9 |
| Days from referral to listing (mean ± SD) | 108 | 258 ± 220 | 302 | 218 ± 188 | .4 |
| Days on waiting list (mean ± SD) | 118 | 972 ± 575 | 320 | 637 ± 466 | <.0001 |
| Days from referral to transplant (mean ± SD) | 108 | 1301 ± 606 | 302 | 878 ± 490 | <.0001 |
Table 1A: Recipient Characteristics by Race, Deceased Donor Transplants
| African American N=50 |
Caucasian N=282 |
P | |||
| Recipient Characteristic | N | Count (%) | N | Count (%) | |
| Gender Female | 50 | 19 (38) | 282 | 115 (41) | .7 |
| Age, years (mean ± SD) | 50 | 41 ± 15 | 282 | 44 ± 15 | .2 |
| Age < 10 Years | 50 | 1(2.0) | 282 | 4(1.4) | |
| Age > 50 Years | 50 | 16(32) | 282 | 98(35) | |
| BMI, kg/m2 (mean ± SD) | 48 | 27.8 ± 5.1 | 262 | 26.7 ± 5.2 | .2 |
| Medicaid patient | 45 | 3 (6.7) | 270 | 21 (7.8) | .8 |
| Primary diagnosis: glomerular disease | 50 | 20 (40) | 282 | 73 (26) | .04 |
| Primary diagnosis: hypertension | 50 | 11 (22) | 282 | 13 (4.6) | <.0001 |
| Primary diagnosis: polycystic disease | 50 | 1 (2.0) | 282 | 52 (18) | .003 |
| Diabetes | 50 | 8 (16) | 282 | 71 (25) | .2 |
| NIDDM | 50 | 2 (4.0) | 281 | 16 (5.7) | 1.0 |
| IDDM | 50 | 6 (12) | 282 | 55 (20) | .2 |
| Pre-transplant dialysis type | 48 | 200 | .4 | ||
| Hemodialysis | 48 | 36 (75) | 200 | 160 (80) | |
| Peritoneal Dialysis | 48 | 12 (25) | 200 | 40 (20) | |
| Pre-transplant dialysis duration, days (mean ± SD) | 48 | 440 ± 314 | 200 | 365 ± 437 | .2 |
| Pre-transplant PRA | 50 | 1.8±8.5 | 282 | 2.5±11 | .7 |
| Days from referral to transplant (mean ± SD) | 36 | 463 ± 247 | 179 | 451 ± 296 | .8 |
Table 1B: Recipient Characteristics by Race, Living Donor Transplants
| Group | N | 30-day | 6-month | 1-year | 3-year | 5-year | 8-year |
| AA LD | 50 | 98% (49) | 96% (48) | 96% (48) | 86% (43) | 80% (35) | 73% (14) |
| W LD | 282 | 97% (274) | 95% (269) | 94% (265) | 85% (240) | 79% (157) | 73% (55) |
| AA DD | 118 | 93% (110) | 86% (102) | 80% (94) | 74% (87) | 62% (60) | 40% (24) |
| W DD | 322 | 97% (312) | 91% (293) | 88% (282) | 81% (261) | 72% (189) | 58% (90) |
Table 2: Graft Survival by Recipient Race and Donor Type
(Numbers in parentheses indicate patients remaining at risk.)
| Group | N | 30-day | 6-month | 1-year | 3-year | 5-year | 8-year |
| AA LD | 50 | 98% () | 96% () | 96% () | 92% () | 92% () | 88% () |
| W LD | 282 | 99% () | 98% () | 97% () | 93% () | 90% () | 88% () |
| AA DD | 118 | 98% (116) | 95% (112) | 92% (108) | 90% (105) | 82% (80) | 66% (36) |
| W DD | 322 | 99% (319) | 96% (309) | 93% (299) | 89% (285) | 82% (218) | 70% (110) |
Table 3: Patient Survival by Recipient Race and Donor Type
(Numbers in parentheses indicate patients remaining at risk.)
References:
- Modlin CS. Culture, race, and disparities in health care. Cleveland Clinic Journal of Medicine. 2003 April; 70(4): 283-288.
- Zaramo CEB, Morton T, Yoo JW, Bowan GR, Modlin CS. Culturally Competent Methods to Promote Organ Donation Rates Among African-Americans Using Venues of the Bureau of Motor Vehicles. Transplantation Proceedings. 2008; 40: 1001-1004.
- Young CJ, Kew C. Health disparities in transplantation: focus on the complexity and challenge of renal transplantation in African Americans. Med Clin North Am. 2005 Sep;89(5):1003-31
- Epstein AM, Ayanian JZ, <em>et al.</em> Racial disparities in access to renal transplantation--clinically appropriate or due to underuse or overuse? N Engl J Med. 2000 Nov 23;343(21):1537-44, 2 p preceding 1537.
- Kasike BL, LondonW, Ellison M: Race and socioeconomic factors influencing early placement on the kidney transplant waiting list. J Am Soc Nephrol 1998;9:2142-7.
- http://optn.transplant.hrsa.gov/ar2008/ 2008 OPTN / SRTR Annual Report: Transplant Data 1998-2007
- http://optn.transplant.hrsa.gov/latestData/rptStrat.asp
- Schweitzer EJ, Wilson J, Jacobs SC, <em>et al.</em> Increased rates of donation with laparoscopic donor nephrectomy. Ann Surg 2000; 232:392–400
- Tankersley MR, Gaston RS, Curtis JJ, <em>et al.</em> The living donor process in kidney transplantation: influence of race and comorbidity. Transplant Proc 1997;29:3722-3723
- Peters TG. Racial Disparities and Transplantation. Am J Kid Dis 2005 Oct; 46(4): 760-762.
- Zhou YC, Cecka JM, Terasaki PI. Effect of race on kidney transplants. Clin Transpl. 1990: 447-459.
- Eckhoff DE, Young CJ, Gaston RS, Fineman SW, Deierhoi MH, Foushee MT, Brown RN, Dietheim AG. Racial disparities in renal allograft survival: a public health issue? J Am Coll Surg. 2007 May; 204(5): 894-902.
- Rajagopalan PR, Rogers J, Chavin K, Baillie GM, Gautreaux M, Pullatt RC, Lin A, Baliga P. Cadaveric renal transplantation in African-Americans in South Carolina. Clin Transpl. 2001: 143-147.
- Foster CE 3rd, Philosophe B, Schweitzer EJ, Colonna JO, Farney AC, Jarrell B, Anderson L, Bartlett ST. A decade of experience with renal transplantation in African Americans. Ann Surg. 2002 Dec; 236(6): 794-804.
- Light JA, Barhyte DY, Lahman L. Kidney Transplants in African-Americans and Non-African Americans: Equivalent Outcomes With Living but Not Deceased Donors. Trans Proc 2005; 37: 699-700.
- Alexander GC, Sehgal AR. Barriers to cadaveric renal transplantation among blacks, women, and the poor. JAMA. 1998 Oct 7; 280(13): 1148-1152.
- Wolfe WA. Achieving equity in referrals for renal transplant evaluations with African-American patients: the role of nephrology social workers. Soc Work Health Care. 2003; 37(3): 75-87.
- Isaacs R. Ethical implications of ethnic disparities in chronic kidney disease and kidney transplantation. Adv Ren Replace Ther. 2004 Jan; 11(1): 55-58.
- Poverty in the United States 2007. http://www.infoplease.com/ipa/A0104520.html.
- Aalten J, Hoogeveen EK, Roodnat JI, Weimar W, Borm GF, de Fijter JW, Hoitsma AJ. Associations between pre-kidney-transplant risk factors and post-transplant cardiovascular events and death. Transpl Int. 2008 Oct; 21(10): 985-991.
- Resende L, Guerra J, Santana A, Mil-Homens C, Abreu F, da Costa AG. Influence of dialysis duration and modality on kidney transplant outcomes. Transplant Proc. 2009 Apr; 41(3): 837-839.
- Tokgoz B. Clinical advantages of peritoneal dialysis. Perit Dial Int. 2009 Feb; 29 Suppl 2: S59-61.
- Rebellato LM, Arnold AN, Bozik KM, Haisch CE. HLA matching and the United Network for Organ Sharing Allocation System: impact of HLA matching on African-American recipients of cadaveric kidney transplants. Transplantation. 2002 Dec 15; 74(11): 1634-1636.
- Zachary AA, Braun WE, Hayes JM, McElroy JB, Novick AC, Schulak JA, Sharp WV. Effect of HLA matching on organ distribution among whites and African-Americans. Transplantation. 1994 Apr 15; 57(7): 1115-1119.
- Singhal AK, Sheng X, Drakos SG, Stehlik J. Impact of Donor Cause of Death on Transplant Outcomes: UNOS Registry Analysis. Trans Proc 2009; 41: 3539-3544.
- Koyama H, Cecka JM, Terasaki PI. Kidney transplants in black recipients. HLA matching and other factors affecting long-term graft survival. Transplantation. 1994 Apr 15; 57(7): 1064-1068.
- Sanfilipo FP, Vaughn WK, Peters TG, Shield CF 3rd, Adams PL, Lorber MI, Williams GM. Factors affecting the waiting time of cadaveric kidney transplant candidates in the United States. JAMA. 1992 Jan 8; 267(2): 247-252.
- Bresnahan BA, Johnson CP, McIntosh MJ, Stablein D, Hariharan S. A comparison between recipients receiving matched kidney and those receiving mismatched kidney from the same cadaver donor. Am J Transplant. 2002 Apr; 2(4): 366-372.
- Grubbs V, Gregorich SE, Perez-Stable EJ, Hsu CY. Health literacy and access to kidney transplantation. Clin J Am Soc Nephrol. 2009 Jan; 4(1): 195-200.
- Reeves-Daniel A, Adams PL, Asssimos D, Westcott C, Alcorn SG, Rogers J, Farney AC, Stratta RJ, Hartmann EL. Impact of race and gender on live kidney donation. Clin Transplant. 2009 Jan; 23(1): 39-49.
- Lunsford SL, Simpson KS, Chavin KD, Menching KJ, Miles LG, Shilling LM, Smalls GR, Baliga PK. Racial disparities in living kidney donation: is there a lack of willing donors or an excess of medically unsuitable candidates? Transplantation. 2006 Oct 15; 82(7): 876-881.
Written by:
Charles S. Modlin, Jr.,a, b Joan M. Alster,c Ismail R. Saad,a Ho Yee Tiong,a Barbara Mastroianni,a Kathy M. Savas,a and Stuart M. Flechnera as part of Beyond the Abstract on UroToday.com. This initiative offers a method of publishing for the professional urology community. Authors are given an opportunity to expand on the circumstances, limitations etc... of their research by referencing the published abstract.
aCleveland Clinic Glickman Urological & Kidney Institute, Section of Renal Transplantation
bCleveland Clinic Minority Men’s Health Center
cCleveland Clinic Department of Quantitative Health Sciences