(UroToday.com) The 2025 GU ASCO annual meeting featured a prostate cancer session and a presentation by Wolfgang P. Fendler, MD, discussing prostate cancer risk groups by PSMA-PET PROMISE results from an international multi-center registry study.
The year 2012 saw the introduction of PSMA PET imaging, and then in 2018 Dr. Fendler and colleagues established prognostic nomograms of PSMA-PET standardized by Prostate Cancer Molecular Imaging Standardized Evaluation (PROMISE) criteria in a large single-center cohort.1 In 2024, the first prognostic nomograms of PSMA PET standardized by PROMISE (PPP1) based on single center data were reported. Presented at GU ASCO 2025, they reassessed the PSMA-PET PROMISE (PPP2) prognostic nomograms in a large international multi-center registry study with overall survival follow-up.
This study included patients with histologically proven prostate cancer who underwent PSMA-PET at 20 hospitals in Germany, Italy, Sweden, Netherlands, Belgium, Slovakia, Austria, United States and Australia between 2014 and 2021. All patients had at least 36 months of overall survival follow-up. PSMA-PET was standardized by molecular imaging TNM. Total tumor volume, PSMA expression score and overall survival follow-up were obtained. The cohort was randomly split 2:1 into development and validation cohorts. In the development cohort the investigators assessed PPP2 predictors and created visual and quantitative PPP2 nomograms based on Cox regression models with least absolute shrinkage and selection operator penalty for overall survival: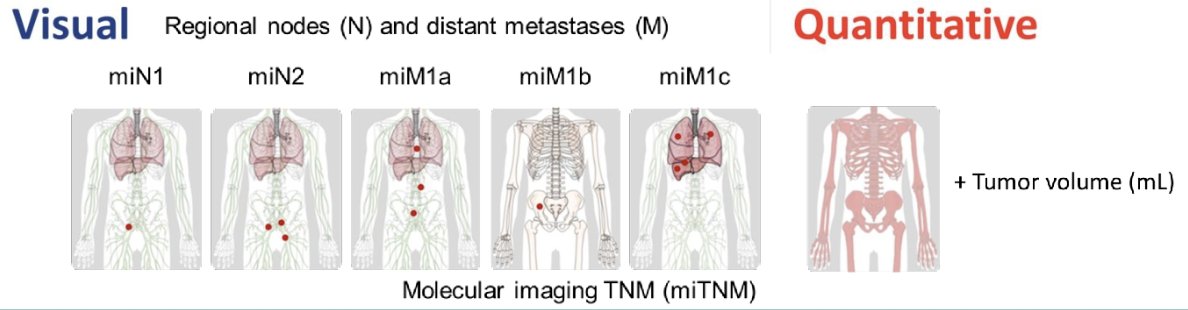
Performance of both nomograms was measured in the validation cohort using Harrell´s C-index and calibration plots, and head-to-head comparison to the NCCN risk score was examined by ROC-curves.
There were 6,128 male patients (4,075 development and 2,053 validation) analyzed across all disease stages with 1,915 (31.2%) reported deaths and median follow-up of 4.77 years (IQR 3.38-6.44). Predictors in the visual PPP2 nomogram were distant metastases: extrapelvic nodal metastases (M1a), bone metastases (M1b; oligometastatic disease, disseminated or diffuse marrow involvement), and organ metastases (M1c), PSMA expression score, and total tumor lesion count. Predictors in the reassessed quantitative PPP2 nomogram were distant metastases (M1a, M1b, and M1c), tumor volume and PSMA expression score. C-indices in the validation cohort were 0.812 (95% CI 0.794 - 0.830) for the visual and 0.821 (95% CI 0.805 - 0.837) for the quantitative nomogram, respectively: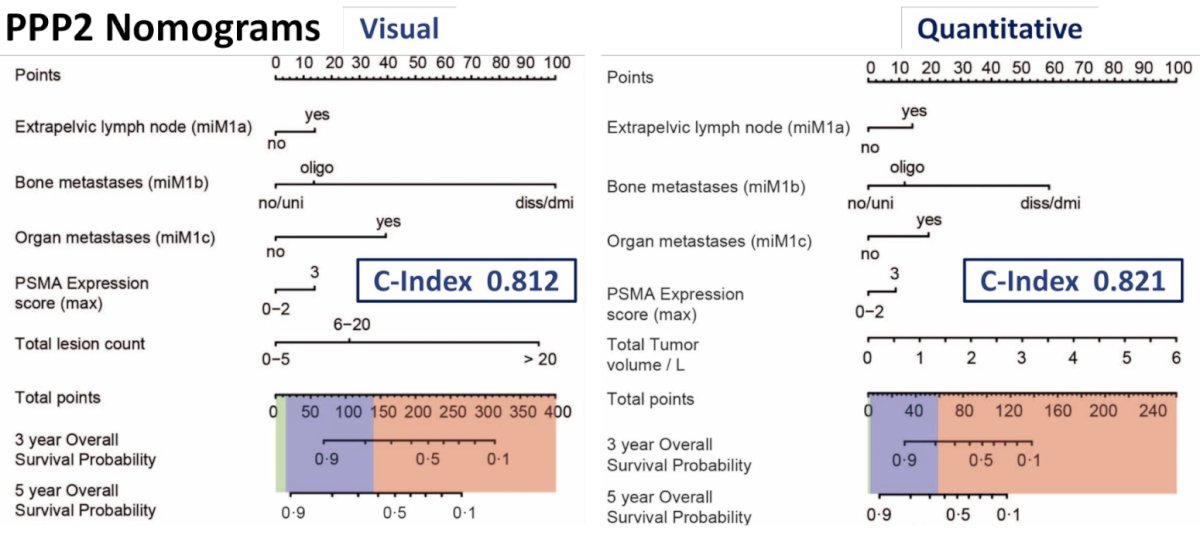
The following shows overall survival curves for all patients, initial staging, biochemical recurrence, non-metastatic castration resistant prostate cancer, metastatic hormone sensitive prostate cancer, and metastatic castration resistant prostate cancer subgroups separate for PPP2 risk groups: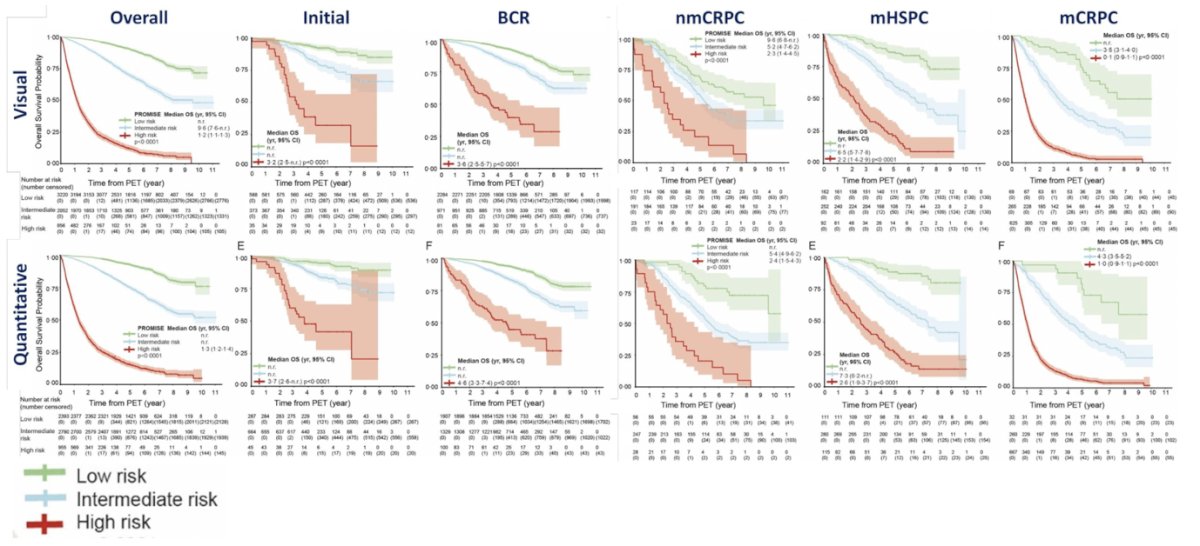
For three-tier stratification (high, intermediate, low risk), accuracy of both PPP2 nomograms was superior when compared to the NCCN risk score (n = 3638, visual: AUC 0.828 versus 0.756; p < 0.0001 and quantitative: AUC 0.837 versus 0.756; p < 0.0001).
Dr. Fendler concluded his presentation discussing prostate cancer risk groups by PSMA-PET PROMISE results from an international multi-center registry study with the following take-home points:
- PPP2 nomograms accurately stratify prostate cancer patients across all disease stages into low versus intermediate versus high risk for overall survival
- PPP2 nomograms yield superior accuracy compared to NCCN
- Follow-up continues in the PROMISE Registry (promise-pet.org)
Presented by: Wolfgang P. Fendler, MD, Department of Nuclear Medicine, University of Duisburg-Essen, and German Cancer Consortium (DKTK), University Hospital Essen, Essen, Germany
Written by: Zachary Klaassen, MD, MSc – Urologic Oncologist, Associate Professor of Urology, Georgia Cancer Center, Wellstar MCG Health, @zklaassen_md on Twitter during the 2025 Genitourinary (GU) American Society of Clinical Oncology (ASCO) Annual Meeting, San Francisco, CA, Thurs, Feb 13 – Sat, Feb 15, 2025.
Reference: